
CLIMATE CHANGE IMPACTS
Erosion (Coastal)
Coastal erosion is a natural process that consists of the breakdown of rock and sediments at the shoreline, both above and below the water surface. In Atlantic Canada, coastal erosion happens due to the action of waves, and to a lesser extent tidal action, wind, storm surge, ice, rain, and surface runoff.
Rates of erosion and deposition are different at various points on the coast. Factors such as exposure and tides can influence the degree to which a shoreline may erode. The type of shoreline, and the type of sediment of which it is composed, are also influential: cliffs, beaches, barrier systems, and salt marshes resist erosion to different degrees.
Changes to climatic conditions and sea-level will also influence the rates of erosion and deposition. Human activities can also affect rates of coastal change. Climate change is expected to result in a rise in sea level and a reduction in sea ice, which will likely increase the rates of erosion in many locations along our coasts.
Coastal erosion will continue to have an impact on coastal communities in the region, and a range of adaptation options should be considered. Many coastal communities will face the decision either to protect the shoreline against erosion through engineering or nature-based approaches, or to retreat and relocate.
How are erosion impacts different at different locations?
Tightly packed vs loosely packed material:
More tightly packed material erodes slower and the erosion process is irreversible, meaning that it cannot be restored.
Loosely packed material will erode quickly, but the process may be reversible and the site can be restored if the material has an opportunity to be transported naturally back into the system or it’s reintroduced by human activity.
Erosion of a slope at bottom vs at top:
Bottom: Erosion at the bottom of a slope is caused by waves hitting the cliff and undercutting at the bottom, thereby weakening the stability of the slope. When the slope becomes unstable, the top portion of the slope can collapse into the water below.
Top: Erosion at the top is often caused by significant rainfall events. When there is a large amount of water running off, it can cut into the slope at the top.
Impacts of man-made structures:
Waves regularly move sediment on and off shore (perpendicular to beach), and along the shore. Infrastructure placed on the coast (e.g. wharfs, shoreline armouring) can interrupt this natural movement of sediment. For example, infrastructure placed perpendicular to the shoreline in areas where significant currents exist can cause sediment build-up on one side of the infrastructure but erosion on the other side.
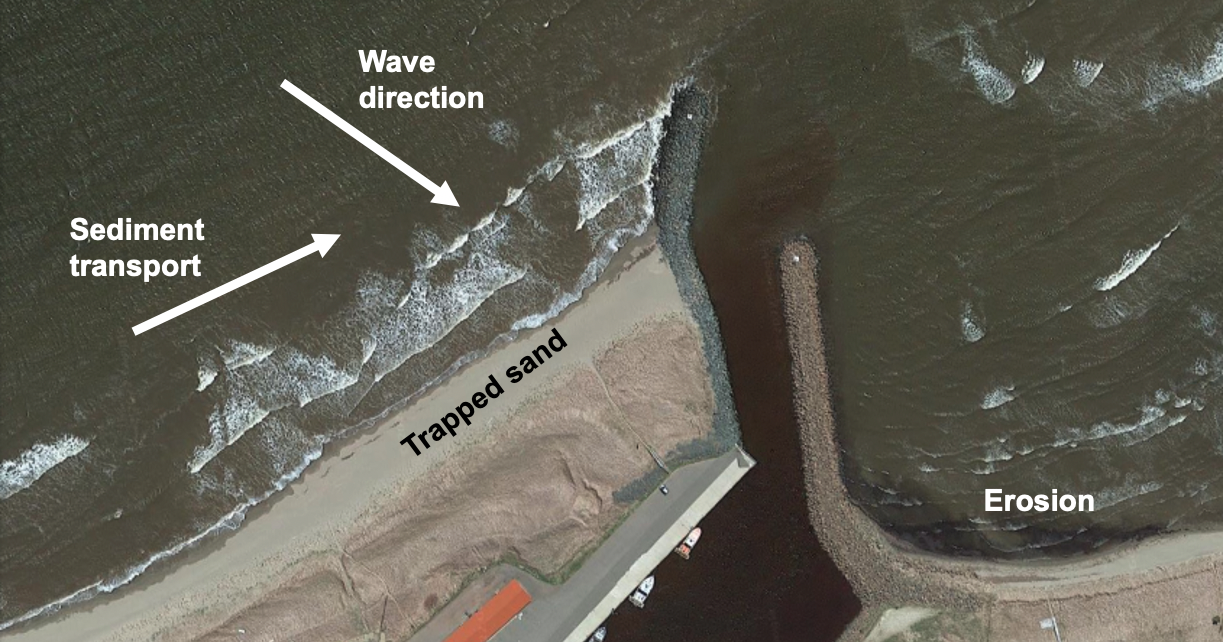
Build-up and erosion in Miminegash Harbour, PEI (Background Image Source: Google, 2015)
Shoreline movement
Below are examples of shoreline movement in the Acadian Peninsula between 1944 and 2012. Move the arrows to see the difference:
[et_pb_ds_before_after_slider before_image=”https://climatlantic.ca/wp-content/uploads/2021/10/Slider_Caraquet_Before.png” before_image_alt=”An aerial image of Caraquet, NB in 1944, with a blue line tracing the 1944 shoreline and a red line tracing the 2012 shoreline. The 2012 shoreline has been built out in places compared to the 1944 line.” after_image=”https://climatlantic.ca/wp-content/uploads/2021/10/Slider_Caraquet_After-1.png” after_image_alt=”An aerial image of Caraquet, NB in 2012, with a blue line tracing the 1944 shoreline and a red line tracing the 2012 shoreline. The 2012 shoreline has been built out in places compared to the 1944 line.” before_label=”1944″ after_label=”2012″ always_show_labels=”on” before_label_bg_color=”rgba(86,86,86,0.75)” after_label_bg_color=”rgba(86,86,86,0.74)” enable_overlay=”off” move_on_hover=”on” admin_label=”Pigeon Hill Slider” _builder_version=”4.23.4″ _module_preset=”default” labels_font=”|600|||||||” background_color=”#565656″ global_colors_info=”{}”][/et_pb_ds_before_after_slider]
[et_pb_ds_before_after_slider before_image=”https://climatlantic.ca/wp/wp-content/uploads/2021/10/Slider_PigeonHill_Before.png” before_image_alt=”An aerial image of Pigeon Hill, NB in 1944, with a blue line tracing the 1944 shoreline and a red line tracing the 2012 shoreline. The 2012 shoreline has eroded significantly compared to the 1944 shoreline.” after_image=”https://climatlantic.ca/wp/wp-content/uploads/2021/10/Slider_PigeonHill_After.png” after_image_alt=”An aerial image of Pigeon Hill, NB in 2012, with a blue line tracing the 1944 shoreline and a red line tracing the 2012 shoreline. The 2012 shoreline has eroded significantly compared to the 1944 shoreline.” before_label=”1944″ after_label=”2012″ always_show_labels=”on” before_label_bg_color=”rgba(86,86,86,0.75)” after_label_bg_color=”rgba(86,86,86,0.74)” enable_overlay=”off” move_on_hover=”on” admin_label=”Pigeon Hill Slider” _builder_version=”4.23.4″ _module_preset=”default” labels_font=”|600|||||||” background_color=”#565656″ custom_margin=”||||false|false” custom_padding=”||||false|false” global_colors_info=”{}”][/et_pb_ds_before_after_slider]
[et_pb_ds_before_after_slider before_image=”https://climatlantic.ca/wp/wp-content/uploads/2021/10/Slider_SainteMarie_Before.png” before_image_alt=”An aerial image of Sainte-Marie-Saint-Raphaël, NB in 1944, with a blue line tracing the 1944 shoreline and a red line tracing the 2012 shoreline. The 2012 shoreline has eroded in part of the image compared to the 1944 shoreline, but has been built out in others.” after_image=”https://climatlantic.ca/wp/wp-content/uploads/2021/10/Slider_SainteMarie_After.png” after_image_alt=”An aerial image of Sainte-Marie-Saint-Raphaël, NB in 2012, with a blue line tracing the 1944 shoreline and a red line tracing the 2012 shoreline. The 2012 shoreline has eroded in part of the image compared to the 1944 shoreline, but has been built out in others.” before_label=”1944″ after_label=”2012″ always_show_labels=”on” before_label_bg_color=”rgba(86,86,86,0.75)” after_label_bg_color=”rgba(86,86,86,0.74)” enable_overlay=”off” move_on_hover=”on” admin_label=”Sainte-Marie-Saint-Raphaël Slider” _builder_version=”4.23.4″ _module_preset=”default” labels_font=”|600|||||||” background_color=”#565656″ global_colors_info=”{}”][/et_pb_ds_before_after_slider]
Saint-Marie-Saint-Raphaël, NB
[et_pb_ds_before_after_slider before_image=”https://climatlantic.ca/wp/wp-content/uploads/2021/10/Slider_SainteMarie_Before_2.png” before_image_alt=”An aerial image of Sainte-Marie-Saint-Raphaël, NB in 1944, with a blue line tracing the 1944 shoreline and a red line tracing the 2012 shoreline. The 2012 shoreline has eroded significantly compared to the 1944 shoreline.” after_image=”https://climatlantic.ca/wp/wp-content/uploads/2021/10/Slider_SainteMarie_After_2.png” after_image_alt=”An aerial image of Sainte-Marie-Saint-Raphaël, NB in 2012, with a blue line tracing the 1944 shoreline and a red line tracing the 2012 shoreline. The 2012 shoreline has eroded significantly compared to the 1944 shoreline.” before_label=”1944″ after_label=”2012″ always_show_labels=”on” before_label_bg_color=”rgba(86,86,86,0.75)” after_label_bg_color=”rgba(86,86,86,0.74)” enable_overlay=”off” move_on_hover=”on” admin_label=”Sainte-Marie-Saint-Raphaël Slider 2″ _builder_version=”4.23.4″ _module_preset=”default” labels_font=”|600|||||||” background_color=”#565656″ global_colors_info=”{}”][/et_pb_ds_before_after_slider]
Saint-Marie-Saint-Raphaël, NB
[et_pb_ds_before_after_slider before_image=”https://climatlantic.ca/wp/wp-content/uploads/2021/10/Slider_Anse_Bleue_Before.png” before_image_alt=”An aerial image of Anse-Bleue, NB in 1944, with a blue line tracing the 1944 shoreline and a red line tracing the 2012 shoreline. The 2012 shoreline has eroded compared to the 1944 shoreline.” after_image=”https://climatlantic.ca/wp/wp-content/uploads/2021/10/Slider_Anse_Bleue_After.png” after_image_alt=”An aerial image of Anse-Bleue, NB in 2012, with a blue line tracing the 1944 shoreline and a red line tracing the 2012 shoreline. The 2012 shoreline has eroded compared to the 1944 shoreline.” before_label=”1944″ after_label=”2012″ always_show_labels=”on” before_label_bg_color=”rgba(86,86,86,0.75)” after_label_bg_color=”rgba(86,86,86,0.74)” enable_overlay=”off” move_on_hover=”on” admin_label=”Anse-Bleue Slider” _builder_version=”4.23.4″ _module_preset=”default” labels_font=”|600|||||||” background_color=”#565656″ global_colors_info=”{}”][/et_pb_ds_before_after_slider]
[et_pb_ds_before_after_slider before_image=”https://climatlantic.ca/wp/wp-content/uploads/2021/10/Slider_Maisonnette_Before.png” before_image_alt=”An aerial image of Maisonnette, NB in 1944, with a blue line tracing the 1944 shoreline and a red line tracing the 2012 shoreline. The 2012 shoreline has eroded compared to the 1944 shoreline.” after_image=”https://climatlantic.ca/wp/wp-content/uploads/2021/10/Slider_Maisonnette_After.png” after_image_alt=”An aerial image of Maisonnette, NB in 2012, with a blue line tracing the 1944 shoreline and a red line tracing the 2012 shoreline. The 2012 shoreline has eroded compared to the 1944 shoreline.” before_label=”1944″ after_label=”2012″ always_show_labels=”on” before_label_bg_color=”rgba(86,86,86,0.75)” after_label_bg_color=”rgba(86,86,86,0.74)” enable_overlay=”off” move_on_hover=”on” admin_label=”Chemin des chalets, Maisonnette Slider” _builder_version=”4.23.4″ _module_preset=”default” labels_font=”|600|||||||” background_color=”#565656″ global_colors_info=”{}”][/et_pb_ds_before_after_slider]
Chemin des chalets, Maisonnette, NB
[et_pb_ds_before_after_slider before_image=”https://climatlantic.ca/wp/wp-content/uploads/2021/10/Slider_Maisonnette_Dune_Before.png” before_image_alt=”An aerial image of Dune de Maisonnette, NB in 1944, with a blue line tracing the 1944 shoreline and a red line tracing the 2012 shoreline. Both shorelines are similar in most of the image, except for the sand dune, which is very long and thin in the 1944 image and has become shorter, wider and moved westward in the 2012 image.” after_image=”https://climatlantic.ca/wp/wp-content/uploads/2021/10/Slider_Maisonnette_Dune_After.png” after_image_alt=”An aerial image of Dune de Maisonnette, NB in 2012, with a blue line tracing the 1944 shoreline and a red line tracing the 2012 shoreline. Both shorelines are similar in most of the image, except for the sand dune, which is very long and thin in the 1944 image and has become shorter, wider and moved westward in the 2012 image.” before_label=”1944″ after_label=”2012″ always_show_labels=”on” before_label_bg_color=”rgba(86,86,86,0.75)” after_label_bg_color=”rgba(86,86,86,0.74)” enable_overlay=”off” move_on_hover=”on” admin_label=”Dune de Maisonnette Slider” _builder_version=”4.23.4″ _module_preset=”default” labels_font=”|600|||||||” background_color=”#565656″ global_colors_info=”{}”][/et_pb_ds_before_after_slider]
Further Reading:
Coastal Erosion and Climate Change (2011). Atlantic Climate Adaptation Solutions Association. Retrieved from: https://atlanticadaptation.ca/en/islandora/object/acasa%253A308