

Image Credit: Adege from Pixabay/Canva
Introduction
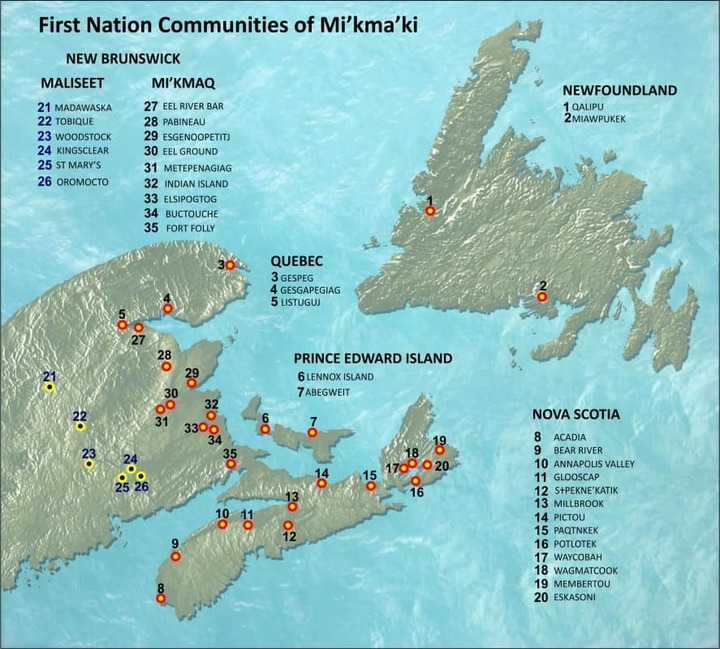
Traditional Indigenous knowledge is an important source of information for understanding the climate. The Mi’kmaq have thrived for well over 13,000 years in the region of Mi’kma’ki, which stretches across the colonial borders of Nova Scotia, Prince Edward Island, eastern New Brunswick, the Gaspé Peninsula of Quebec, and Newfoundland. The Mi’kmaw language is strongly connected to nature and demonstrates a deep understanding of ecological patterns in this region. One example of this knowledge is the Mi’kmaw calendar, based on lunar cycles, where each moon is named for an important biophysical indicator of the changing seasons.
This series of posts will explore the Mi’kmaw calendar from the perspective of the changing climate, including some analysis of climate data trends that relate to each moon. Learning from traditional knowledge helps us understand how the climate is already different from what was normal in this region for thousands of years. Analyzing climate data helps us understand the changes still to come.
Any climate data shown are from the latest downscaled projections for Canada (CMIP6), accessed via ClimateData.ca. Values are the median results for averaged 30-year periods, and are geographically specific to the community mentioned.
September
In the Mi’kmaw calendar, the September moon is known as Wikumkewiku’s (we-goom-gay-we-goos), the mate calling moon. This period covers the approximate date range of September 7 to October 8. This time marks the rutting season for moose, with their behaviour including more frequent vocalized calls. Historically, this was the time when the Mi’kmaq would migrate from summer camps by the seashore to winter camps located inland, closer to the moose.
Some research indicates a warmer fall can delay moose breeding, as moose are less active on warm days to avoid overheating. In Wagmatcook First Nation, the average maximum temperature during the month of September was 18.2°C during the period 1951-1980. With climate change, maximum temperatures are already slightly warmer, averaging 18.8°C during the period 1981-2010. The following table shows how the average maximum temperature in September is projected to change over time under both low and high emission scenarios for this area.
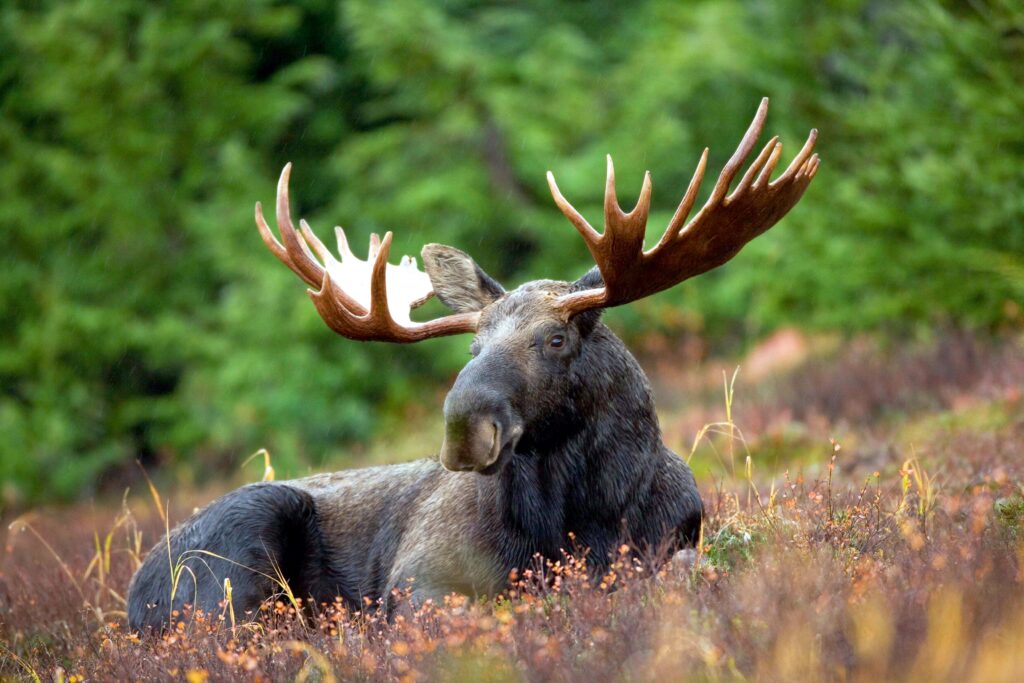
Image credit: pixabay/PublicDomainImages/Canva
Average maximum temperature in September
|
||
Time period |
Low emissions(SSP2-4.5) |
High emissions(SSP5-8.5) |
| 1951-1980 | 18.2°C | |
| 1981-2010 | 18.8°C | |
| 2011-2040 | 20.0°C | 20.0°C |
| 2041-2070 | 21.1°C | 21.9°C |
| 2071-2100 | 22.0°C | 24.7°C |
The average daily high temperature in September may be nearly 4 degrees warmer by the end of the century under a low emissions scenario, and over 6 degrees warmer under a high emissions scenario. These warmer conditions could impact animal behaviour, particularly for species like moose that have a low tolerance to temperature stress.
August
In the Mi’kmaw calendar, the August moon is known as Kisikewiku’s (gis-ig-ay-we-goos), the berry ripening moon. This period covers the approximate date range of August 7 to September 7. This is the time when fruits, such as blueberries and raspberries, have ripened and are ready to be gathered.
The frost-free season, measured in days, is the approximate length of the growing season during which there are no sub-zero temperatures to damage frost-sensitive plants. In Fort Folly First Nation, the frost-free season lasted for an average of 134 days during the period 1951-1980. The length of the frost-free season increased during the period 1981-2010, lasting an average of 142 days. The following table shows how the length of the frost-free season is projected to change over time under both low and high emission scenarios for this area.
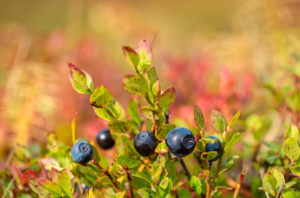
Image credit: klikk/Getty Images/Canva
Length of frost-free season (days)
|
||
Time period |
Low emissions(SSP2-4.5) |
High emissions(SSP5-8.5) |
| 1951-1980 | 134 | |
| 1981-2010 | 142 | |
| 2011-2040 | 156 | 157 |
| 2041-2070 | 172 | 180 |
| 2071-2100 | 183 | 212 |
Warmer average temperatures result in a longer frost-free season. By the end of the century, the frost-free season in Fort Folly First Nation could extend by 45 days under a low emissions scenario, or by 73 days under a high emissions scenario. A longer growing season may present an opportunity to produce more food or grow different types of crops, but it also tends to increase the risk of damage from a variety of pests, diseases, or invasive species which may be better adapted to warmer growing conditions.
July
In the Mi’kmaw calendar, the July moon is known as Peskewiku’s (bes-gay-we-goos), the birds shedding feathers moon. This period covers the approximate date range of July 6 to August 7. This is the time when many birds shed and replace their feathers. Feathers naturally wear out from use and weather, meaning birds must molt to create fresh, healthy feathers. This molting often occurs during mid-late summer, a time of abundant food between the stressful periods of nesting and migration.
Heat warnings are commonly issued when temperatures reach a threshold near 30°C, indicating that temperatures may cause stress to living beings. In Glooscap First Nation, there were an average of 1 day per year that exceeded 30°C during the period 1951-1980. This increased slightly during the period 1981-2010, with an average of 3 days. The following table shows the projected changes to the number of days with maximum temperatures over 30°C over time under both low and high emission scenarios for this area.

Image credit: nstanev/Getty Images/Canva
Number of days with maximum temperature >30°C
|
||
Time period |
Low emissions(SSP2-4.5) |
High emissions(SSP5-8.5) |
| 1951-1980 | 1 | |
| 1981-2010 | 3 | |
| 2011-2040 | 6 | 6 |
| 2041-2070 | 12 | 18 |
| 2071-2100 | 19 | 49 |
As average temperatures continue to rise with climate change, there will be a substantial increase in the number of hot days. By the end of the century, there may be almost three weeks of days over 30°C in Glooscap First Nation under a low emissions scenario, or seven weeks under a high emissions scenario. High temperatures determine whether plants and animals can thrive, with hot temperatures also impacting human health and infrastructure. Heat stress in summer will likely become a more common issue for humans, animals, and plants.
June
In the Mi’kmaw calendar, the June moon is known as Nipniku’s (nib-nee-goos), the trees fully leafed moon. This period covers the approximate date range of June 5 to July 6. With longer days and warming temperatures, this is the time when buds on trees unfurl into full new canopies of leaves.
Growing degree days are a measure of whether climate conditions are warm enough to support plant growth. In Pabineau First Nation, there were an average of 1565 growing degree days (base of 5ºC) per year during the period of 1951-1980. The number of growing degree days then increased during the period of 1981-2010, averaging 1679 growing degree days. The following table shows projected changes for the number of growing degree days over time under both low and high emission scenarios for this area.
Image credit: famingjia inventor/Pexels/Canva
Number of Growing Degree Days (base 5ºC)(Pabineau First Nation) |
||
Time period |
Low emissions(SSP2-4.5) |
High emissions(SSP5-8.5) |
| 1951-1980 | 1565 | |
| 1981-2010 | 1679 | |
| 2011-2040 | 1918 | 1933 |
| 2041-2070 | 2145 | 2324 |
| 2071-2100 | 2323 | 2978 |
By the end of the century, growing degree days in Pabineau may increase by around 33% under a low emissions scenario, or around 47% under a high emissions scenario. This represents a substantial increase in the energy available for plant growth, meaning that certain plants may start to flower, develop leaves, and produce seeds or fruit earlier in the year.
May
In the Mi’kmaw calendar, the May moon is known as Sqoljuiku’s (skoalch-ooh-we-goos), the frog croaking moon. This period covers the approximate date range of May 5 to June 5. Sqolj is the Mi’kmaw word for frog, after the sound of their croaks. This is the time when frogs and toads sing their springtime song to attract a mate. Their behaviour is driven by warming temperatures and increased rainfall, which creates new ponds and puddles to safely lay eggs in.
In Eskasoni First Nation, an average of 358 mm of precipitation fell in the spring during the period 1951-1980. This amount was nearly the same during the period 1981-2010, averaging 359 mm. The following table shows how the amount of spring precipitation is projected to change over time under both low and high emission scenarios for this area.
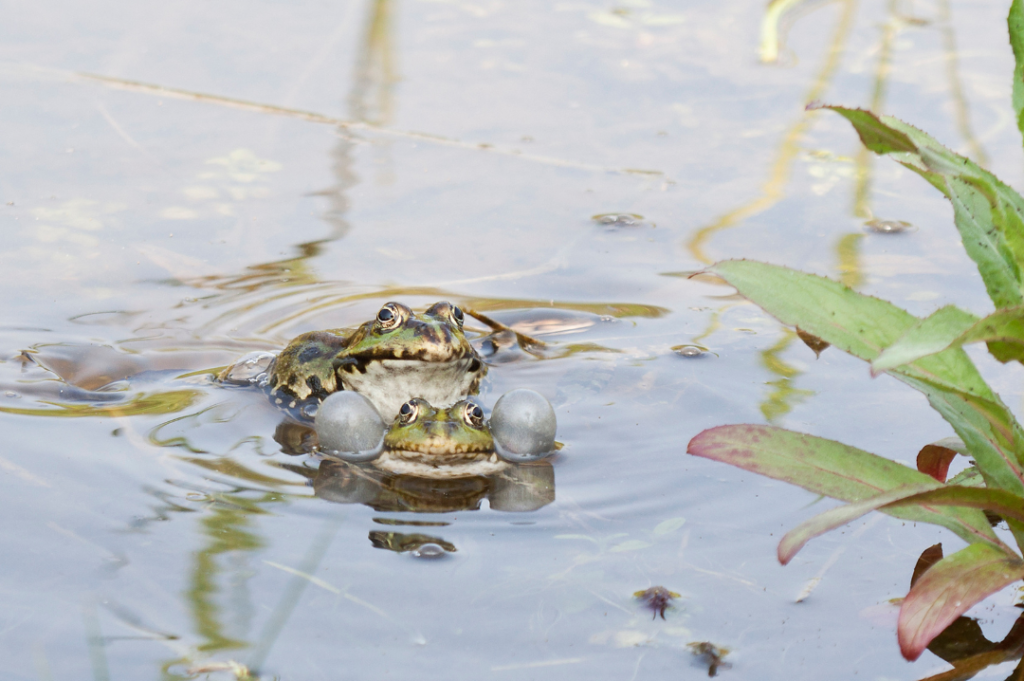
Image credit: AttaBoyLuther/Getty Images Signature/Canva
Spring Precipitation (mm)(Eskasoni First Nation) |
||
Time period |
Low emissions(SSP2-4.5) |
High emissions(SSP5-8.5) |
| 1951-1980 | 358 | |
| 1981-2010 | 359 | |
| 2011-2040 | 377 | 380 |
| 2041-2070 | 393 | 402 |
| 2071-2100 | 395 | 409 |
Warmer air holds more moisture, resulting in higher typical precipitation amounts across the region. By the end of the century, spring precipitation amounts in Eskasoni may increase by around 10% under a low emissions scenario, or nearly 14% under a high emissions scenario. More rain falling could create wetter conditions for creatures like frogs, but higher temperatures also increase evaporation rates, meaning that ponds and soils could dry out more quickly.
April
In the Mi’kmaw calendar, the April moon is known as Penatmuiku’s (ben-a-dim-ooh-we-goos), the birds laying eggs moon. This period covers the approximate date range of April 4 to May 5. This is the time when birds collect twigs, grass, and other materials to build and repair their nests in preparation for egg laying. The timing of egg laying is often matched to the increasing availability of food sources, such as insects that start to emerge in greater numbers as the harsh conditions of winter recede.
Another indicator of the coming spring during this time may be the final frost event, signalling a return to consistently warmer temperatures. In Lennox Island First Nation, the last spring frost occurred on May 13, on average, during the period of 1951-1980. With climate change this last frost has been occurring earlier, with May 10 being the more typical date during the period of 1981-2010. The following table shows how the date of the last spring frost is projected to change over time under both low and high emission scenarios for this area.
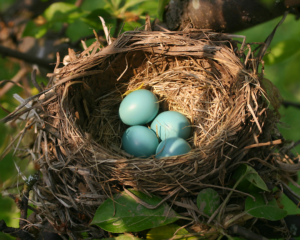
Image credit: AttaBoyLuther/Getty Images Signature/Canva
Date of last frost in spring(Lennox Island First Nation) |
||
Time period |
Low emissions(SSP2-4.5) |
High emissions(SSP5-8.5) |
| 1951-1980 | May 13 | |
| 1981-2010 | May 10 | |
| 2011-2040 | May 3 | May 3 |
| 2041-2070 | April 27 | April 23 |
| 2071-2100 | April 20 | April 9 |
Rising temperatures will continue to push the average date of the last spring frost earlier in the year. By the end of the century, the last spring frost may occur almost three weeks earlier under a low emissions scenario, or about five weeks earlier under a high emissions scenario. Species may adapt their behaviour to align with these changes, with some studies showing that many bird species have already started laying eggs earlier than they did historically.
March
In the Mi’kmaw calendar, the March moon is known as Siwkewiku’s (see-uke-ay-we-goos), the spring time moon, also known as the maple sugar moon. This period covers the approximate date range of March 5 to April 4, which is typically the time when maple sap was distilled from sugar maple trees, practiced by the Mi’kmaq long before settlers arrived. Sap flow in maple trees is dependent on temperature, typically requiring temperatures to drop below freezing (0°C) at night and rise above freezing during the day. When air temperatures fluctuate between freezing and non-freezing temperatures on the same day, it is known as a freeze-thaw cycle.
In Elsipogtog First Nation, there were an average of 82 days per year with a freeze-thaw cycle during the period of 1951-1980. The average number of annual freeze-thaw cycles is already slightly lower, with an average of 80 freeze-thaw cycles during the period of 1981-2010. The following table shows how the number of freeze-thaw cycles is projected to change over time under both low and high emission scenarios for this area.
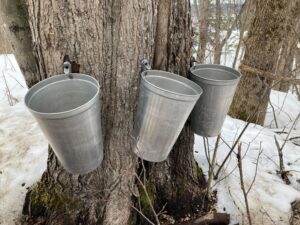
Image of sugar maple trees with taps and buckets to collect sap for the production of maple syrup.
Number of freeze-thaw cycles(Elsipogtog First Nation) |
||
Time period |
Low emissions(SSP2-4.5) |
High emissions(SSP5-8.5) |
| 1951-1980 | 82 | |
| 1981-2010 | 80 | |
| 2011-2040 | 77 | 78 |
| 2041-2070 | 74 | 74 |
| 2071-2100 | 73 | 67 |
The number of freeze-thaw cycles per year is projected to decrease slightly across Mi’kma’ki. By the end of the century, it may be more typical to see a total of 73 freeze-thaw cycles per year in this community under a low emissions scenario, or 67 freeze-thaw cycles per year under a high emissions scenario. As temperatures continue to rise, the timing of these freeze-thaw events may also change, with more freeze-thaw cycles taking place during the winter season and fewer taking place during spring and fall. The changing climate could impact the timing and viability of maple syrup production in the region.
February
In the Mi’kmaw calendar, the February moon is known as Apuknajit (ah-boo-gah-na-jit), the snow blinding moon. This period covers the approximate date range of February 3 to March 5. Apuknajit is a legendary Mi’kmaw spirit or wizard that can shapeshift, taking on the appearance of any animal. It is customary during this full moon to leave food out as an offering to Apuknajit to ensure the survival of the entire ecosystem. Traditionally, this is the hardest time of year for the Mi’kmaq, as heavy snow falls made hunting more difficult. It is the brightest time of the winter due to the sun reflecting off the snow, which can cause snow blindness – a painful sunburn to the eye’s cornea.
In Miawpukek (Conne River) First Nation, there were an average of 58 days per year with snowfall during the period of 1951-1980. Warmer temperatures have already slightly reduced the number of snowy days, with an average of 55 days with snowfall during the period of 1981-2010. The following table shows how the number of days with snow is projected to change over time under both low and high emission scenarios for this area.
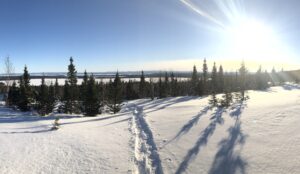
Birch Brook, Labrador.
Number of Days with Snow(Miawpukek First Nation) |
||
Time period |
Low emissions(SSP2-4.5) |
High emissions(SSP5-8.5) |
| 1951-1980 | 58 | |
| 1981-2010 | 55 | |
| 2011-2040 | 48 | 48 |
| 2041-2070 | 43 | 39 |
| 2071-2100 | 40 | 27 |
Warming winters will significantly reduce the frequency of snowfall across Mi’kma’ki, as precipitation would instead fall as rain if temperatures are above freezing. By the end of the century, there may be an average of 40 days per year with snowfall in this community under a low emissions scenario, or only 27 days per year with snowfall under a high emissions scenario. Winters across the region will look and feel quite different with fewer snowy days.
January
In the Mi’kmaw calendar, the January moon is known as Punamujuiku’s (boo-na-moo-jooey-goos), the tomcod (frost fish) moon. This period covers the approximate date range of January 5 to February 3. This is the time when the punamu (tomcod) run from river estuaries upstream to spawn. Fishing for tomcod was an important food source for the Mi’kmaq during this time.
This period is typically when the coldest day of the year might occur. In Sipekne’katik First Nation, the average coldest temperature of the year was -24.8°C during the period 1951-1980. The coldest temperature has already been slightly higher during the period 1981-2010, at -23.8°C. The following table shows how the coldest temperature of the year is projected to change over time under both low and high emission scenarios for this area.
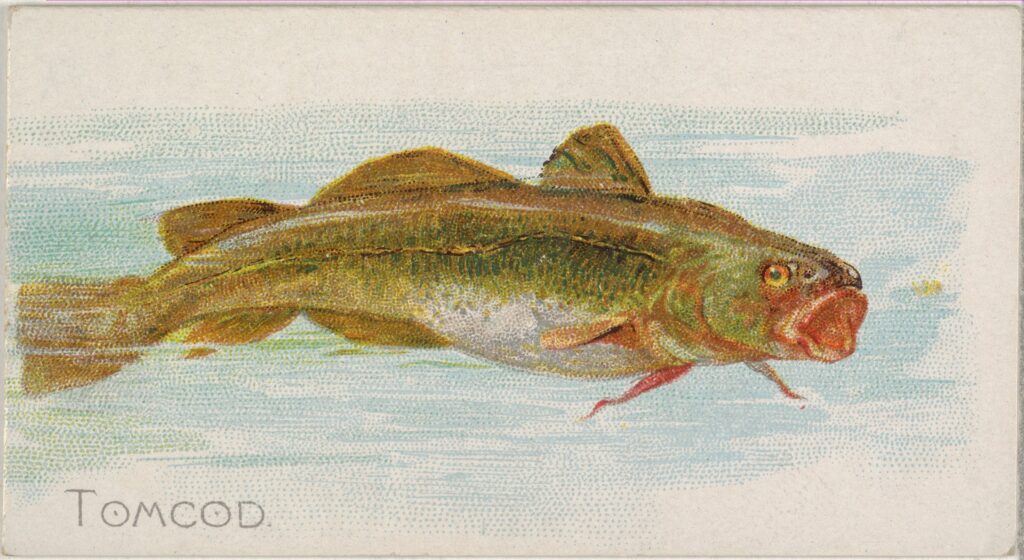
Tomcod illustration from “Fish from American Waters series (N8)” issued by Allen & Ginter. Credit: The Metropolitan Museum of Art/RawPixel.
Coldest temperature of the year
|
||
Time period |
Low emissions(SSP2-4.5) |
High emissions(SSP5-8.5) |
| 1951-1980 | -24.8°C | |
| 1981-2010 | -23.8°C | |
| 2011-2040 | -21.2°C | -20.9°C |
| 2041-2070 | -18.6°C | -17.1°C |
| 2071-2100 | -17.0°C | -13.0°C |
This reduction in extreme cold is one of the most notable impacts of the changing climate across Mi’kma’ki. Even under a relatively optimistic low emissions scenario, the coldest day of the year in this region may be nearly eight degrees warmer by the end of the century. Under a high emissions scenario, the typical coldest day may be close to 12 degrees warmer. While extreme cold can pose human health risks for those who are not adequately prepared, cold winter temperatures are important for many native species and environmental processes.
December
In the Mi’kmaw calendar, the December moon is known as Kesikewiku’s (ges-ig-gay-we-goos), the winter moon. This period covers the approximate date range of December 6 to January 5, which includes the winter solstice, the shortest day of the year, and the full moon that rises highest in the sky. Typical winter conditions across Mi’kma’ki include colder air temperatures, freezing waters and snowfall.
As the climate warms, these typical winter conditions become less common. In Abegweit First Nation, the average temperature during winter (Kesik) was -5.6°C during the period of 1951-1980. The average winter temperature has already been slightly warmer during the following period of 1981-2010, averaging -5.0°C. The following table shows how the average winter temperature is projected to change over time under both low and high emission scenarios for this area.
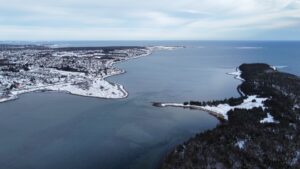
Drone photo of Eastern Passage, NS, February 2023. Photo courtesy of David Jones.
Average winter temperature (Abegweit First Nation) |
||
Time period |
Low emissions(SSP2-4.5) |
High emissions(SSP5-8.5) |
| 1951-1980 | -5.6°C | |
| 1981-2010 | -5.0°C | |
| 2011-2040 | -3.4°C | -3.2°C |
| 2041-2070 | -2.0°C | -1.0°C |
| 2071-2100 | -1.0°C | 1.0°C |
The season of Kesik (winter) is the time of year that is warming the most rapidly. Compared to what was normal historically, winters by the end of the century may be around 4.4°C warmer under a low emissions scenario, and 6.5°C warmer under a high emissions scenario. Milder winters mean that, on average, communities across Mi’kma’ki will experience more frequent temperatures above freezing (0°C), less extreme cold, and less snow and ice.
November
In the Mi’kmaw calendar, the November moon is known as Keptekewiku’s (geb-deg-gay-we-goos), the rivers freezing over moon. This period covers the approximate date range of November 7 to December 6. This was the time when temperatures started to regularly drop below 0°C and surface waters across Mi’kma’ki would first start to show signs of freezing over.
In Natoaganeg (Eel Ground) First Nation on the Miramichi River, there were an average of 79 ice days each year during the period 1951-1980. Ice days occur when temperatures remain below freezing for the entire day, meaning thicker, stable ice can form and persist. As the climate has warmed the number of ice days has already started to decrease, with 73 ice days being more typical during the period 1981-2010. The following table shows how the number of ice days is projected to change over time under both low and high emissions scenarios for this area.
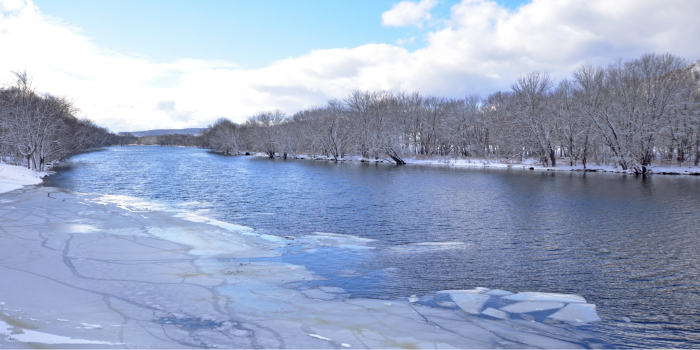
Image credit: Winter on the Kennebecasis River, Hampton, New Brunswick, Canada — Greenseas, Getty Images/Canva
Number of annual ice days (Natoaganeg First Nation) |
||
Time period |
Low emissions(SSP2-4.5) |
High emissions(SSP5-8.5) |
| 1950-1980 | 79 | |
| 1980-2010 | 73 | |
| 2011-2040 | 61 | 59 |
| 2041-2070 | 48 | 39 |
| 2071-2100 | 40 | 21 |
Compared to what was normal historically, the number of ice days is projected to be nearly halved by the end of the century under a low emissions scenario, and about a quarter of what used to occur under a high emissions scenario. Fewer ice days may result in freeze-up occurring later in the winter, and could mean rivers may not freeze over consistently or for as long. This may cause impacts on freshwater ecosystems and cultural practices such as ice fishing.
October
In the Mi’kmaw calendar, the October moon is known as Wikewiku’s (wig-gay-we-goos), the animal fattening moon. This period covers the approximate date range of October 8 to November 7. This is the time when animals across Mi’kma’ki are foraging and feeding to fatten up for the long, cold winter ahead.
One of the main indicators of the coming winter during this period is the first frost event in fall. In Bear River First Nation, the first fall frost occurred on October 7, on average, during the period of 1951-1980. With climate change this first frost has been occurring later, with October 12 being a more typical date in the period 1981-2010. The following table shows how the date of the first fall frost is projected to change over time under both low and high emission scenarios for this area.
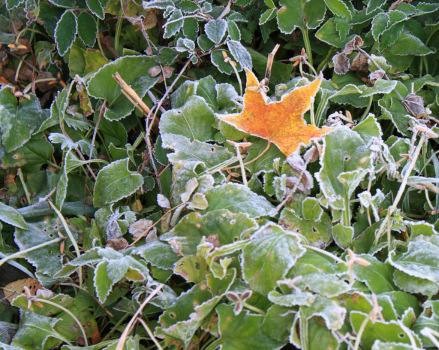
Image credit: Daizuoxin from Getty Images/Canva
Date of first frost in fall (Bear River First Nation) |
||
Time period |
Low emissions(SSP2-4.5) |
High emissions(SSP5-8.5) |
| 1950-1980 | October 7 | |
| 1980-2010 | October 12 | |
| 2011-2040 | October 23 | October 22 |
| 2041-2070 | October 28 | November 3 |
| 2071-2100 | November 4 | November 22 |
The first frost event in fall occurring several weeks later in the year may impact when and how animals prepare for the winter. More food may be available later into the year, and winters may not be as long or as harsh. Some animals may be able to adjust their behaviors for these changing conditions, but others will struggle with this rapid rate of climatic change.
Recent Comments